Introduction

Public health is a non-negligible topic when people mention social improvement and individual health, as the integral part of public health, is something unavoidable to everybody. For keeping health, some people prefer traditional physical exercising, while others are more willing to try auxiliary health care products, such as nutrition food and healthcare medicine.

“Are they effective? Do they have any side effect?”, it seems that people’s answers can be different and controversial. User reviews on Amazon.com are an informative source of interesting insight into people’s attitude to health care products. In this project, we decided to take a look into reviews of health care products on Amazon over a period of time, to find answers to questions that interest us:

How people view health care products?

Dataset exploration

The dataset we use is Amazon product data, which contains 142.8 million Amazon product reviews and metadata from May 1996 to July 2014. In this project, we will precisely focus on the Health and Personal Care subset to give some insights and our unique understandings of reviews. The Health and Personal Care subset contains about 3,000,000 reviews.

Rating distribution

First, let’s see how reviews grades are distributed among Health and Personal Care products and observe the overall characteristics.

From these two figures, we can apparently see that the number of high rating products or reviews is significantly greater than that of low rating, which means consumers tend to give high ratings to products rather than low ratings.

Do these distributions of review ratings really represent product quality or consumer satisfaction? Yes, to some extent, they do. However, they do not reflect how positively or negatively people write their reviews. In order to see positiveness and negativeness of reviews, we do sentiment analysis and measure the sentiment in the review text.

Key words and sentiment of all reviews

Before diving into the numerical analysis of sentiment, let’s have a look at the keywords of reviews to have an intuitive impression of sentiment in reviews first. Here we use frequency of words in reviews to represent the keyness and focus on the most emotionally representative parts in reviews –– adjectives and bigrams.

Word Cloud of Adjective in All Years
Figure3_Word cloud of POS in all years
Word Cloud of Bigrams in All Years
Word cloud of bigrams in all years

Keywords in adjectives and bigrams do give us a general impression of consumers’ sentiment in reviews. We can see that in key words of adjectives, positive words such as 'good', 'great', 'nice', have a pretty high probability. Although negative words such as 'bad', 'old' also occupy a high probability, they are obviously lower. Roughly, we can say reviews on health care products in these years are mainly positive!

Then we do a further and detailed sentiment analysis utilizing VADER package, which can give us a quantitative compound score of sentiment.

According to the definition of the compound score, the review can be regarded as positive if its score is larger than 0.05 or negative if the score is below -0.05, otherwise, the review is considered as neutral. From the figure above, we can get a consistent conclusion as before: Most reviews are positive, while a relatively smaller amount of reviews is negative and only a few are neutral.

To see whether there is a difference between a rating and its associated review’s sentiment, we scale the sentiment score to the same [1, 5] range as rating and visualize the difference among each sub-category of Health Care products:

It is clearly seen that sexual wellness products have the most positive difference in all sub-categories, which means people think much more positively in reviews than the rating. By contrast, the difference between sentiment score and rating of Vitamins & Dietary Supplements and Health & Care are the most 2 negative with similar values indicating that people are actually not satisfied as they rate. Then let’s put our attention to more detailed level—the products.

From the distribution of difference among each product, we can see that most of the mass of it is concentrated between -1 and 0, which shows a pretty consistent phenomenon as above: Consumers tend to give a higher rating than they actually think.

The trend of Popularity

Review quantity growth

Popularity is the state or condition of being liked, admired, or supported by many people. The popularity of one product is apparently related to the number of its sales, which is, unfortunately, different from the number of reviews. However, we can intuitively suppose that the number of sales and reviews have a positive correlation, which means the more one product is sold, more reviews it will get. Therefore, to some extent, we can say that the amount of reviews indeed reflects the popularity of products among people.

We visualize the trend of reviews amount of Health Care products per day as below.

Trend of sentiment and key words

However, we will encounter similar problems as we mentioned before: The amount of reviews is only a numerical count which cannot reflect sentiment orientation of the popularity of the product. To get into the depth of trend of popularity, here we analyze the change of sentiment in reviews over years.

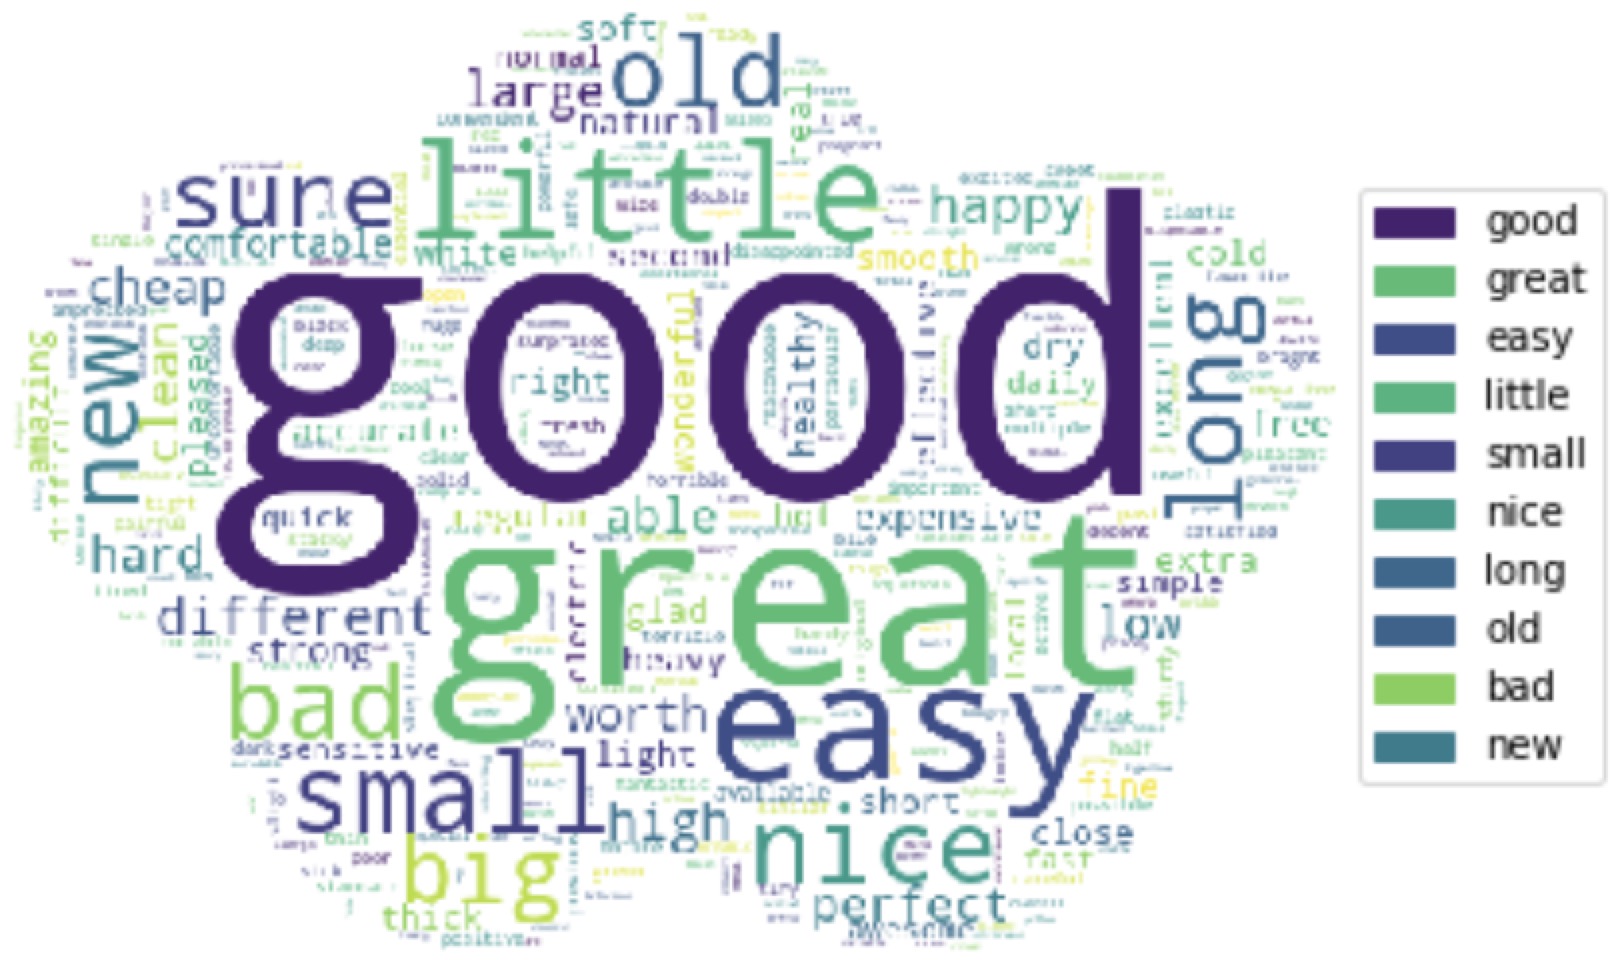
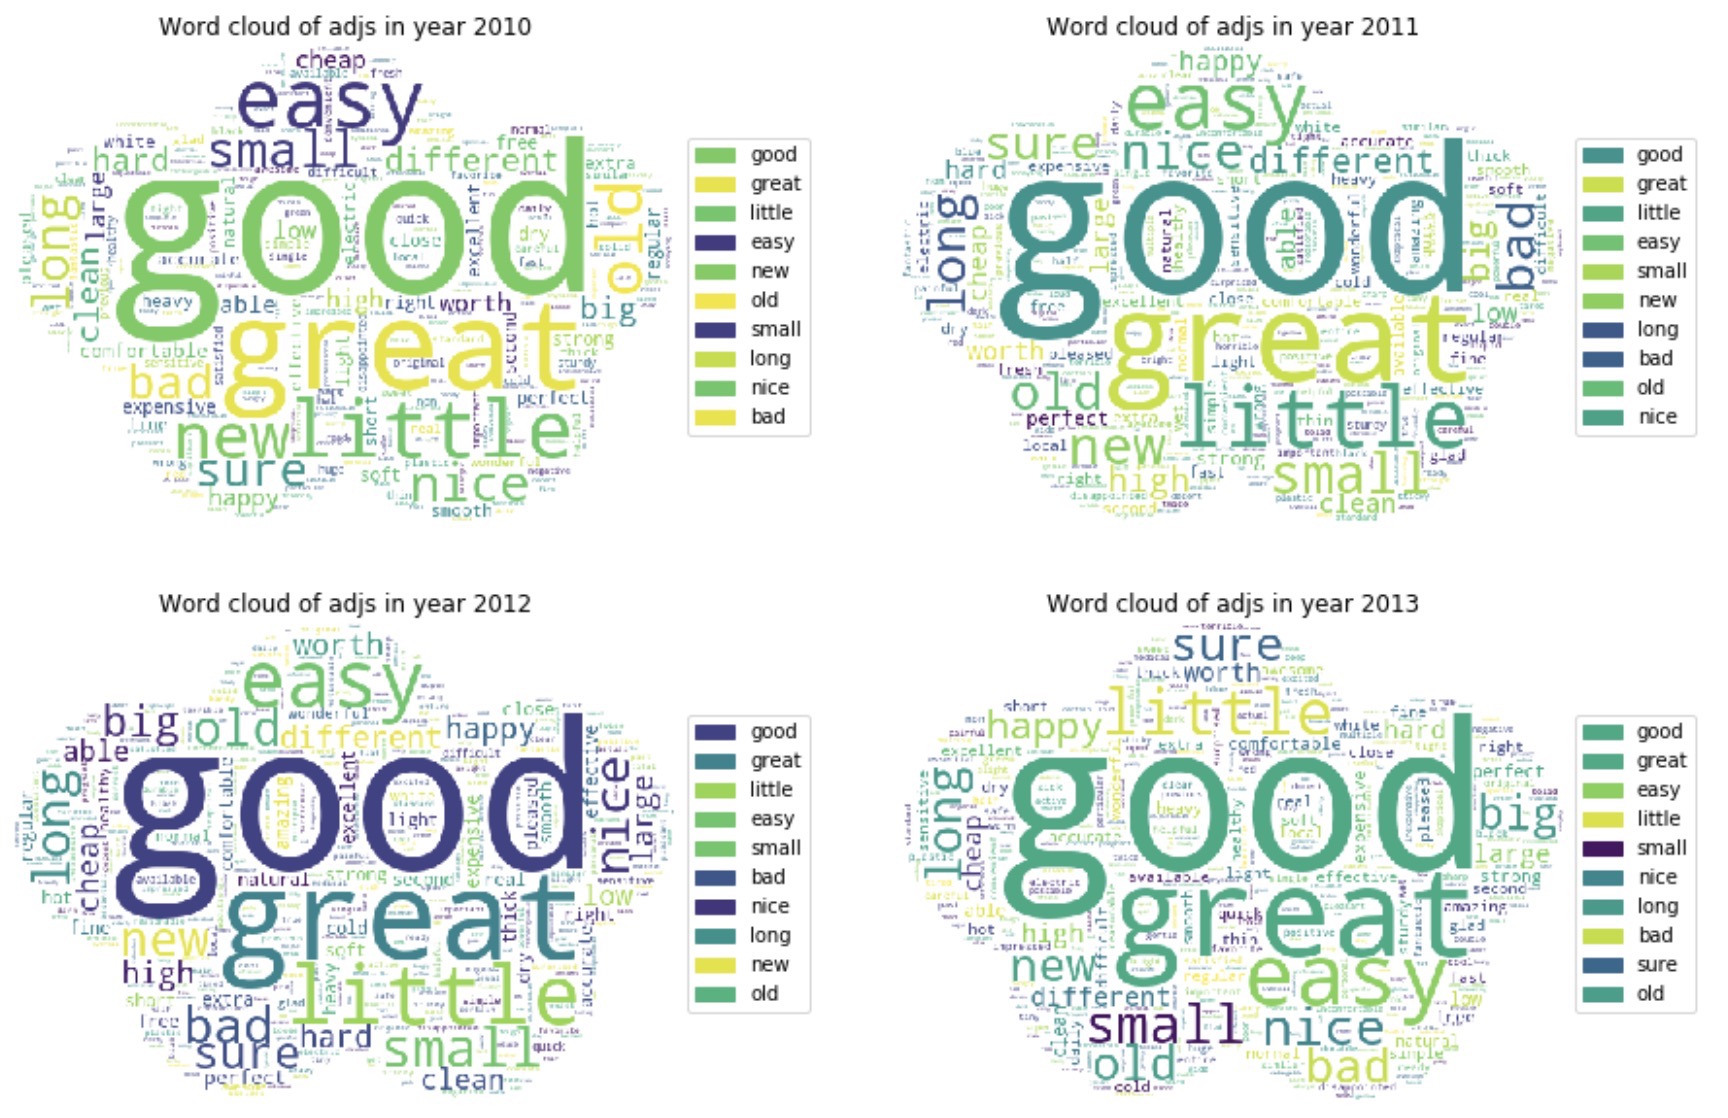
Trend of Adjectives Over Years
Figure10_Word cloud of adjectives over years
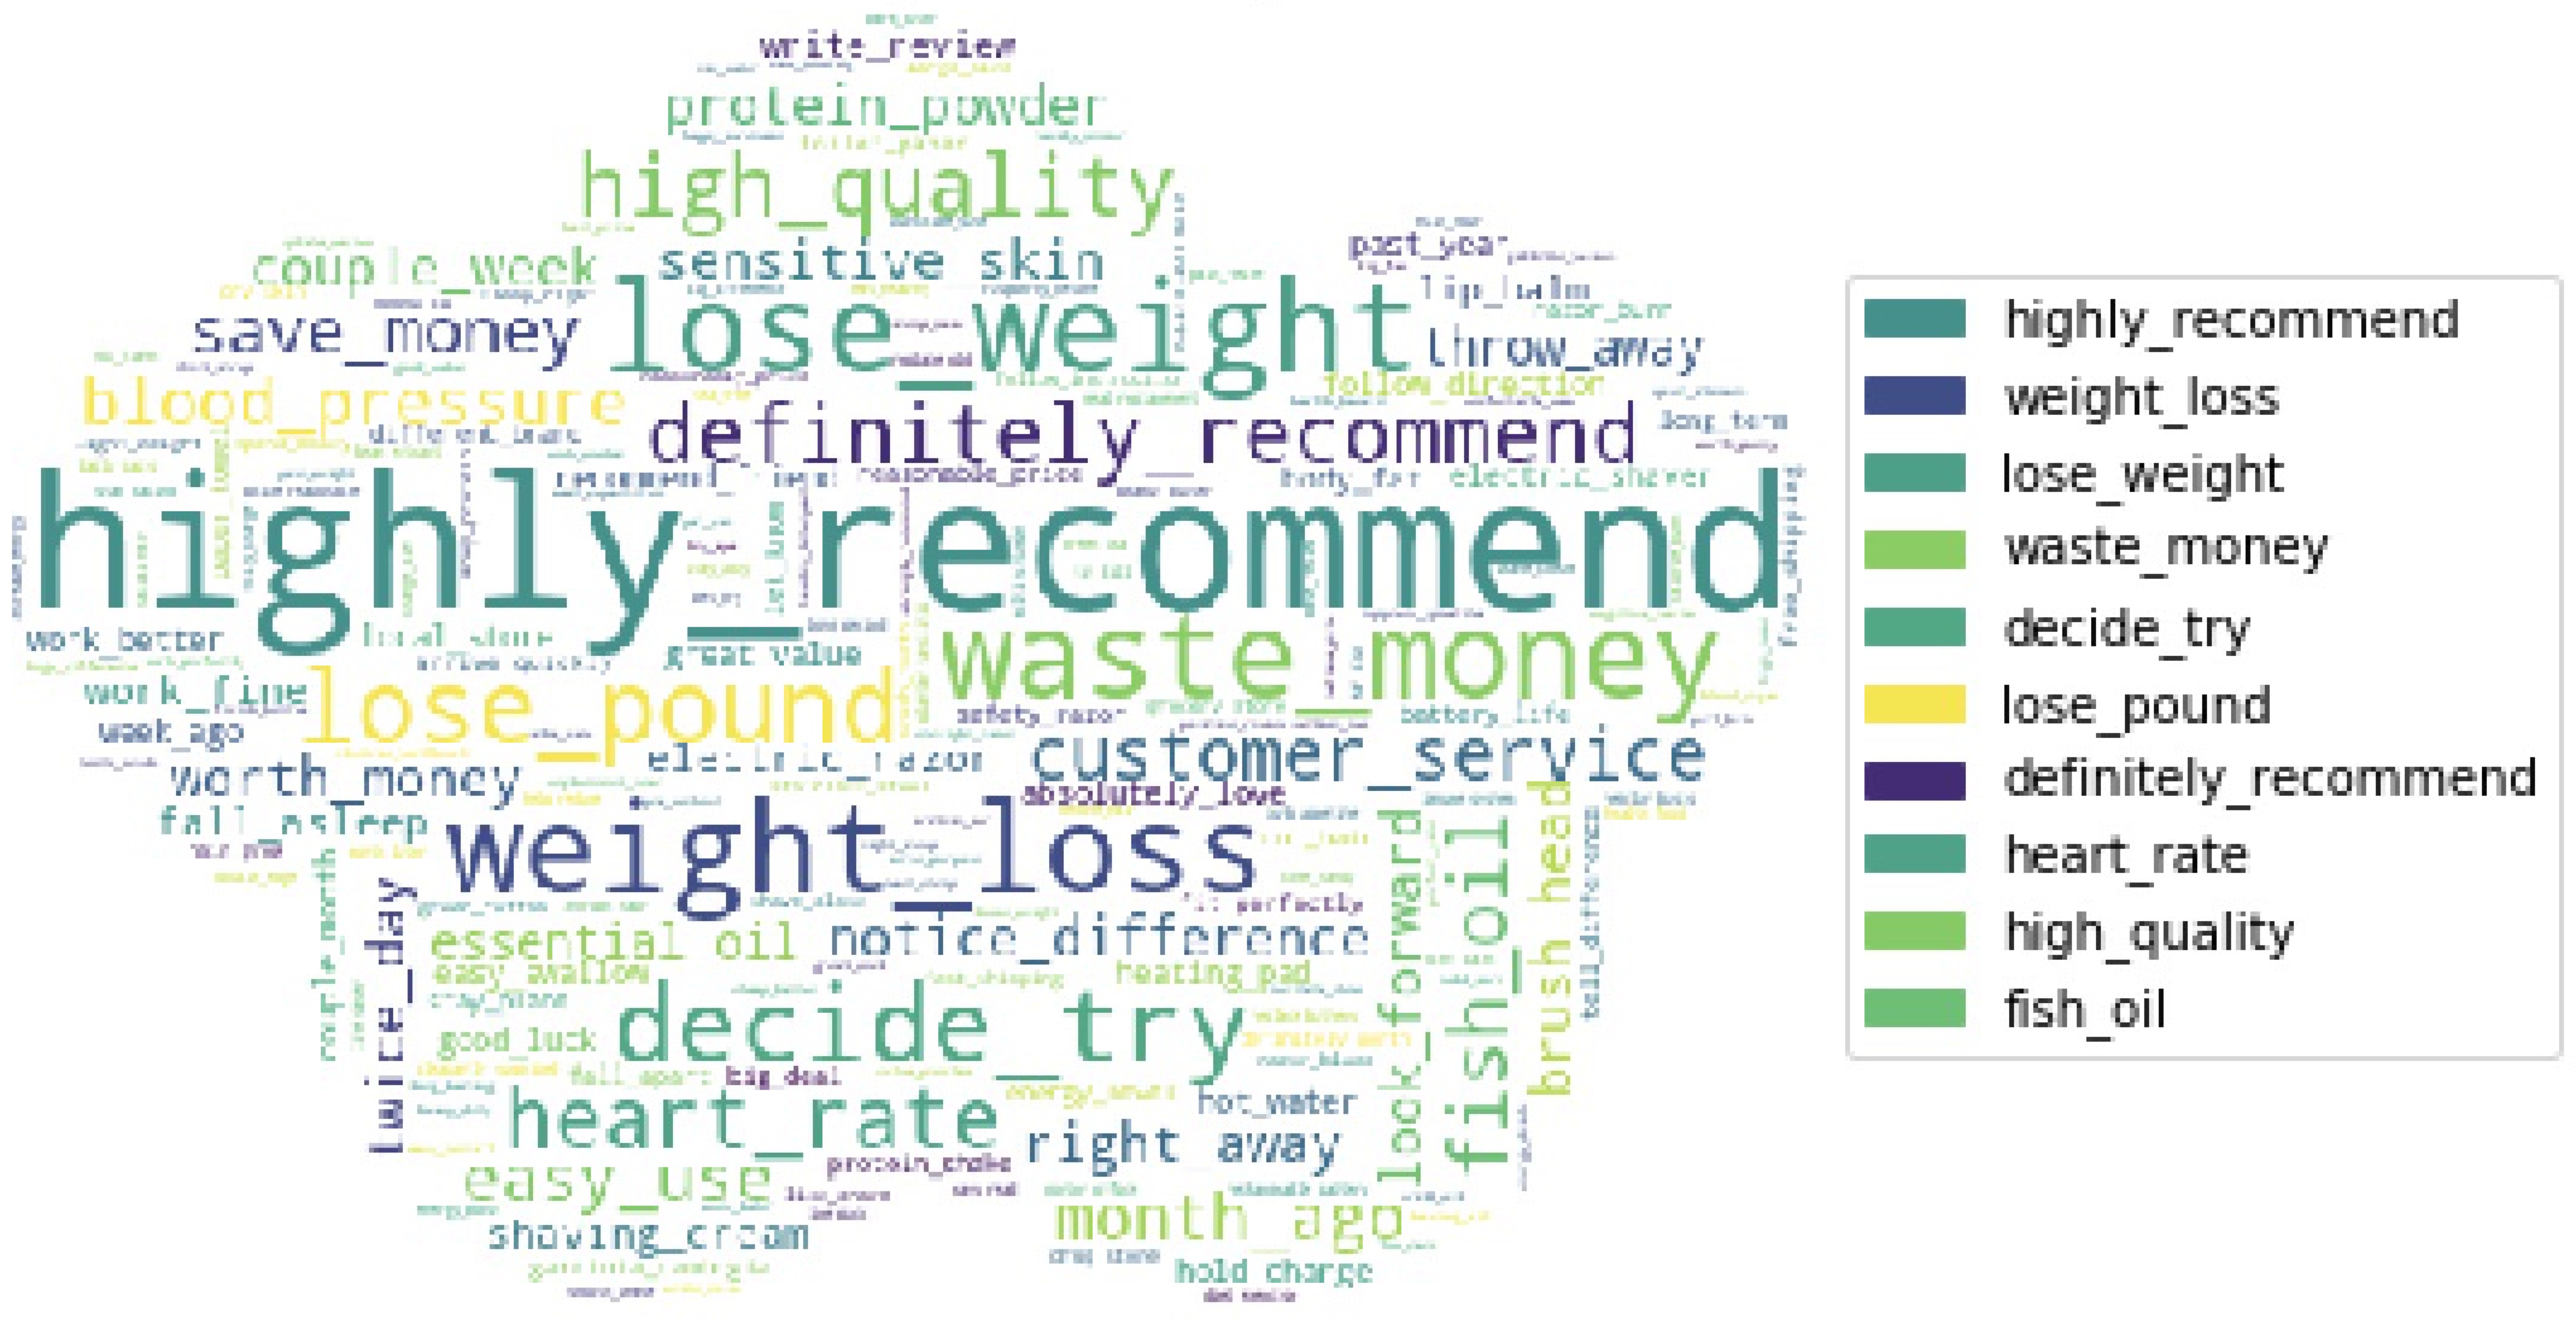
Trend of Bigrams Over Years
Figure11_Word cloud of bigrams over years

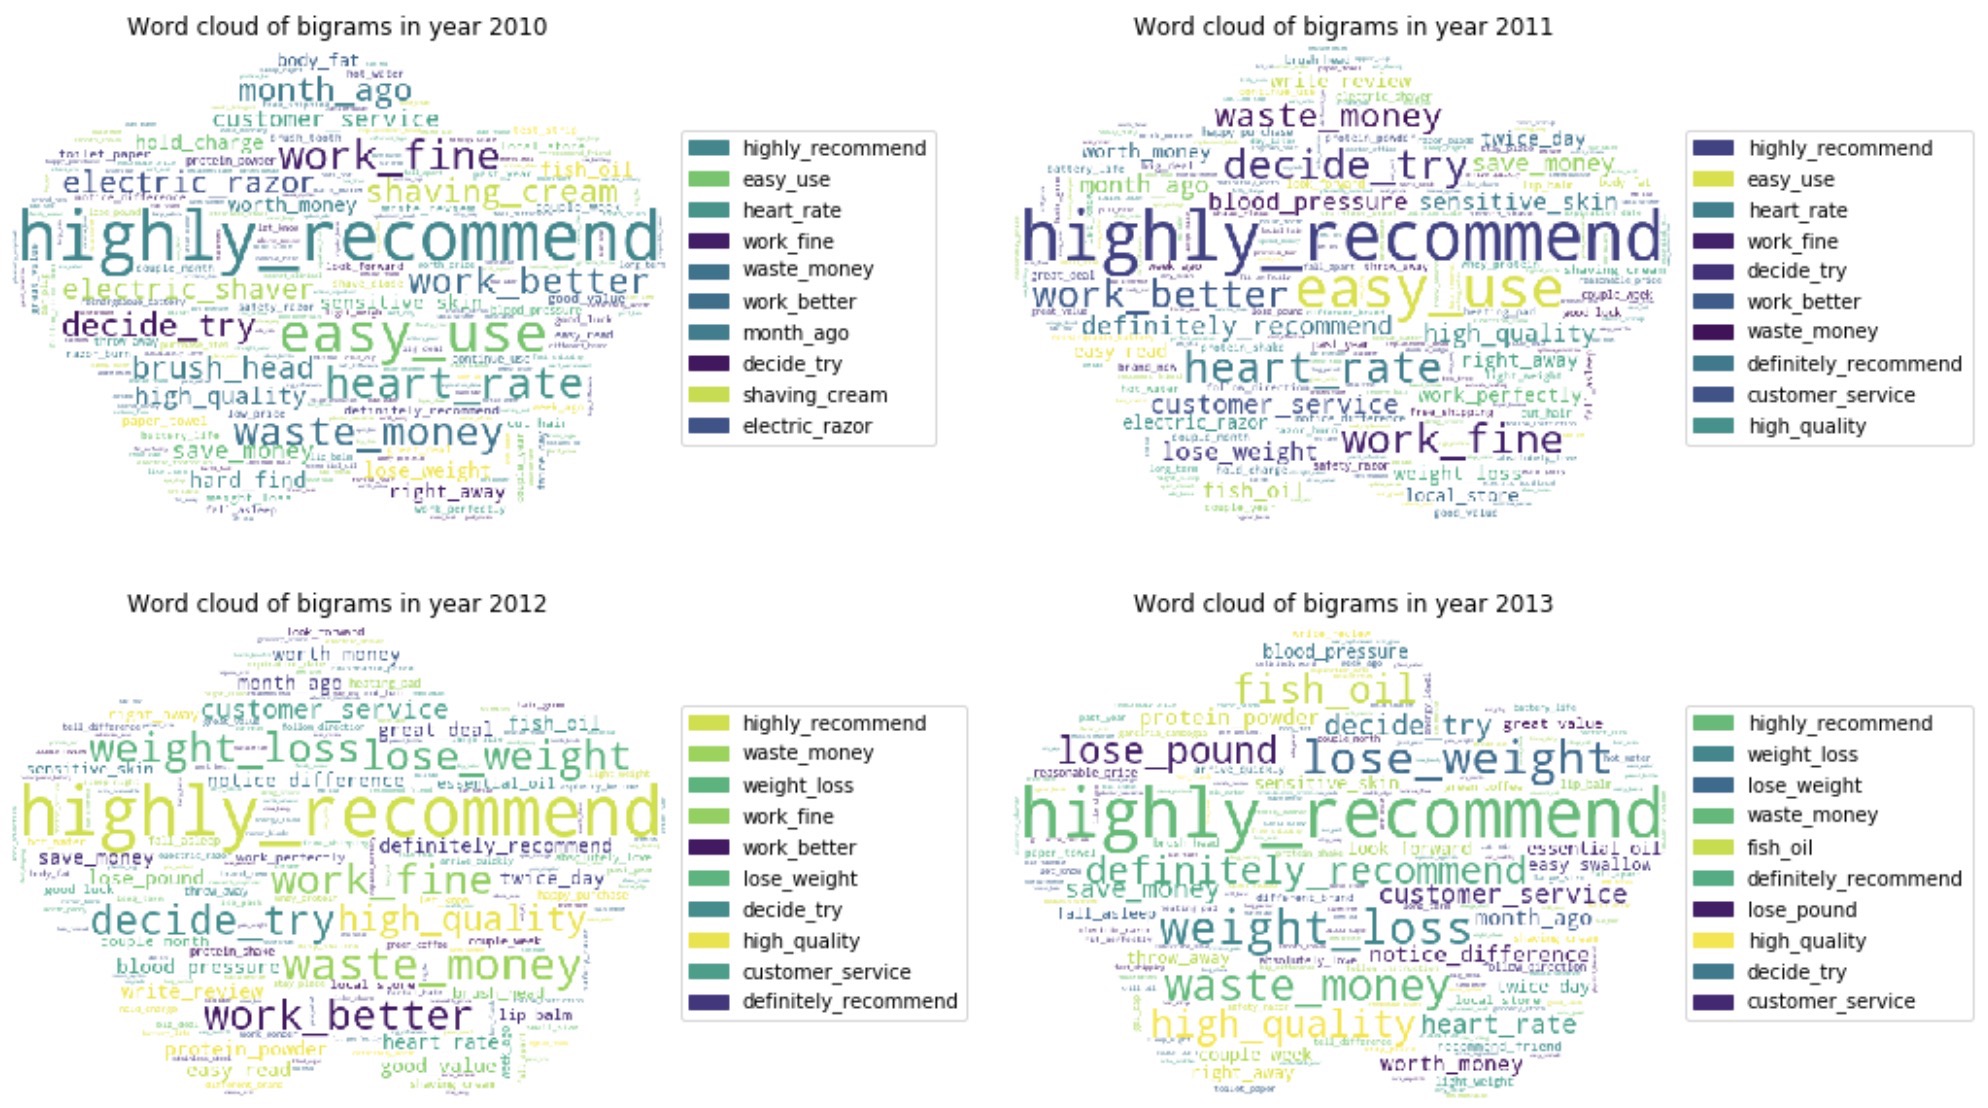
From the year 2010 to 2013, the top 10 keywords of Health Care products in adjectives remain quite stable, in which positive words 'good' and 'great' are dominant and have a much higher probability than the negative word 'bad'. Similarly for bigrams, 'highly recommend', which can naturally be regarded as a positive bigram, always has the highest frequency. So, roughly, we can say that health care products always have a positive evaluation in general and keep popular over these years.

What’s more, we find a phenomenon that 'heart rate' occurs frequently from 2010 to 2011, however, it disappears from top 10 key bigrams and is replaced by 'lose weight' after 2012. Interesting! It seems that people pay more attention to their appearance than before and they are more willing to buy health care products to build a slim figure.

Apparently, the score of Health & Personal Care products keep fluctuating violently in the previous several years, which may indicates that the people’s evaluation and attitude to Health Care products were various and unstable during this period. After 2008, the fluctuation becomes slighter and it seems to go down below 4 during year 2013 and then keep fluctuating up and down within the smaller range from 3.95 to 4, which may be explained that people are more likely to think that Health Care products are generally good but with some small shortcomings.

Seasonal decomposition and special day

Will the popularity of Health Care products be influenced by some specific date? To answer this question, let’s look at the time series decomposition of the data, which decomposes the data into a trend component, a seasonal component and a residual (noise component). Since the amount of reviews is too small before 2004 and the dataset seems not to contain the whole sales data in 2014, we only treat the 2004-2013 interval.

We can observe that there is a seasonal changing pattern of the number of reviews under the yearly growth. The seasonal component starts to grow from November, reaches its peaks around January and then drops, which is, surprisingly, in the Christmas season! It can be seen that special date, especially Christmas, does have an impact on the popularity of Health Care products. We infer that people tend to buy more Health Care products and send them as gifts, which significantly boost consumption. While after Christmas, the need for health care products gradually falls back.

So how does the Christmas season influence the popularity in detail? Let’s go into the deep analysis of Christmas season and see if there is any difference among review quantity, rating, key words and sentiment score compared to values of whole year.

For review quantity of Christmas season, we notice that after 2009, the number of reviews in Christmas season starts to be larger than year’s day average review number and the gap between them is becoming more and more huge as year goes by. We suppose it might because after 2009, with the invention and wide use of smartphones, people are handier to buy products in Amazon using their phones. Another reason might be that the price of Health Care products is always much cheaper online. Especially on Christmas Day, online stores may offer a really excellent discount and significantly boost the sales. Also, in order to celebrate Christmas, the most important day in the year, people may be willing to consume more Health Care product like nutritious food.

The line chart above compares the trend of average rating in Christmas season with that in whole year. During 2004-2009, the average rating in Christmas day fluctuate remarkably, which indicates that people in these year’s Christmas Day take a skeptical attitude toward the healthy product. Sometimes they give a high rating, while sometimes low. However, after 2009, they are more likely to give a good rating for Health Care product on Christmas Day, which probably because the quality of the products are improved under Amazon’s strong supervision.

Conclusion

In conclusion, we can see many interesting features of how people view Health Care Products. In general, people’s attitude to health care products in these years are mainly positive. These is some unavoidable difference between people’s ratings and their associated review’s sentiment, which means people tend to give a higher rating than they actually think. However, the difference is not very remarkable and close to 0. Considering the trend of popularity of Health Care product, we find it always has a positive evaluation in general and keeps popular over these years. Some special dates do have an impact on the popularity of Health Care products, such as Christmas which seems can boost the sales.